
The chart below shows the total number of minutes (in billions) of telephone call in the UK, divided into three categories, from 1995-2002.
Summarise the information by selecting a reporting the main features, and make comparisons where relevant.
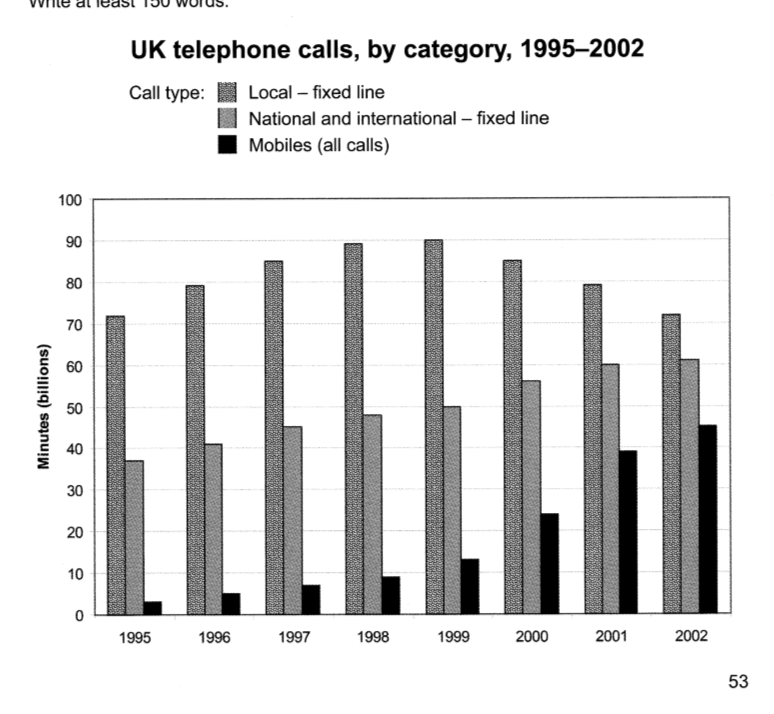
The bar graph delineates the time spent in billion minutes by UK citizens on telephone calls, classified in three different call types that is Local, National and international, and Mobile (all calls) between 1995 and 2002.
Overall, the minutes spent talking via both national and international -fixed lines and mobiles witnessed an upward trend during the seven-year period. Simultaneously, local calls were the most popular category over the whole period.
Particularly, in 1995, the British talked for more than 70 billion minutes through local – fixed lines. This figure saw an upward trend until 1999, reaching 90 billion minutes and then declined until 2002, ending at the same number of minutes as in 1995. By contrast, minutes spent by people talking over national and international – fixed lines started from just beneath 40 billion and increased to just above 60 billion minutes, in 2002. The same pattern was followed by the calls made by mobiles, in 1995 the figure accounted for almost 5 billion minutes, and rose to 45 billion minutes, significantly being at the bottom during all the years.
(165 words)