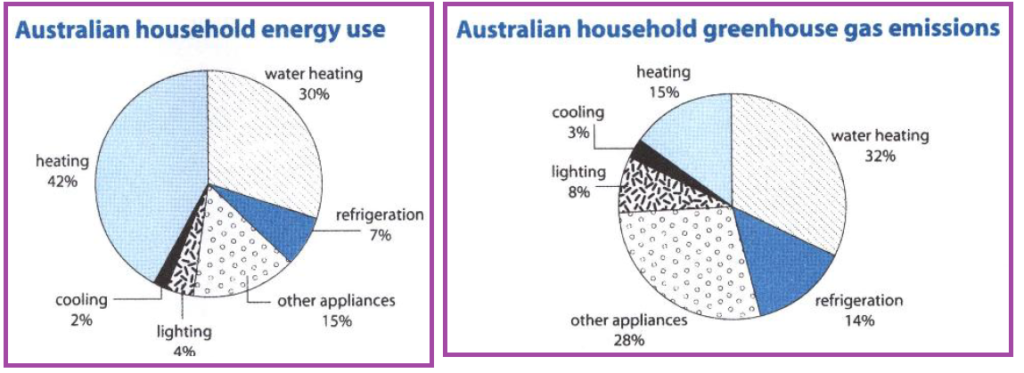
The first chart below shows how energy is used in an average Australian household. The second chart shows the greenhouse gas emissions which result from this energy use.
Summarise this information by selecting and reporting the main features, and make comparisons where relevant.
Band 7 Sample Answer, how energy is used in an average Australian household

The first pie chart illustrates the average usage of energy in housing in Australia. while the other provides information about the emission of greenhouse gas due to such consumption of energy.
Overall, a significant majority of energy was consumed for heating in contrast with a trivial amount of it was used up for cooling purposes. Nevertheless, most of the harmful gases were emitted by heating water.
With regards to the usage of energy, heating took around 42% of energy, while water heating consumed just under one-third of the total energy. Cooling consumed the least energy, just 2 % which was half of the amount used for lighting. Refrigeration consumption was about 7% and the remaining contributed to other appliances.
Water heating, which was dominant in liberating greenhouse gas, released around 32% that was approximately double the emission from refrigeration and heating. Cooling contributed to the smallest proportion of emission (about 3%) which was almost 5% less than that from lighting. The left out 28% came from other appliances.

