
The first chart below shows how energy is used in an average Australian household. The second chart shows the greenhouse gas emissions which result from this energy use.
Band 7 Sample Answer
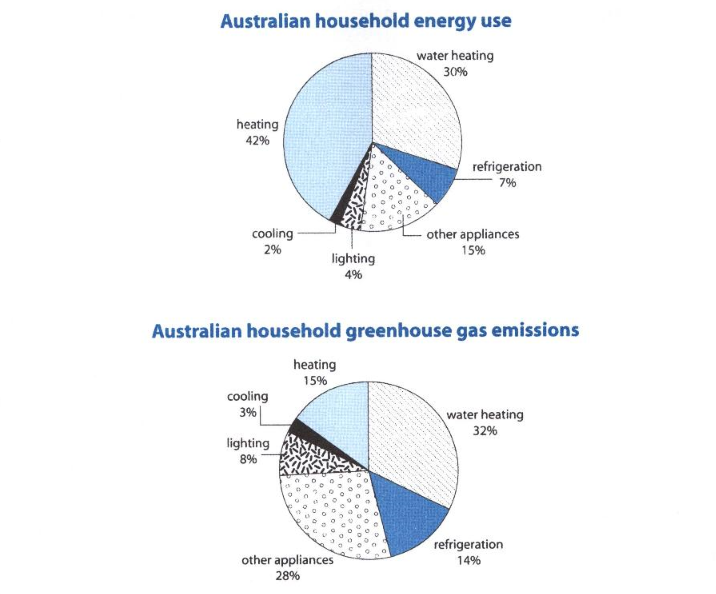
The first pie chart illustrates the energy that an Australian household spends, while the second chart depicts the emissions of greenhouse gas due to this energy use.
A glance at the first chart reveals that Australian citizens use most of the energy on heating and water heating. Whereas the second graph delineates that water heating and other appliances primarily contribute to greenhouse gas emissions.
Particularly, heating makes up just over two-fifths of the total efficiency consumption in an Australian household. While 30% of energy is consumed for water heating. Simultaneously, Australian householders spend half the power that they use for water heating on other appliances and only a tiny proportion is consumed for refrigeration, lighting, and cooling with 7%, 4%, and 2% respectively.
Regarding greenhouse gas emissions, water heating and other appliances possess the highest percentages, standing at nearly a third each. Meanwhile, the rate of greenhouse gas emissions is 50% lower for heating and refrigeration than the rates of water heating and other appliances, but the smallest proportion is presented by lighting and cooling, which account for 8% and 3% respectively.
(182 words)