
Band 7 IELTS Task-1
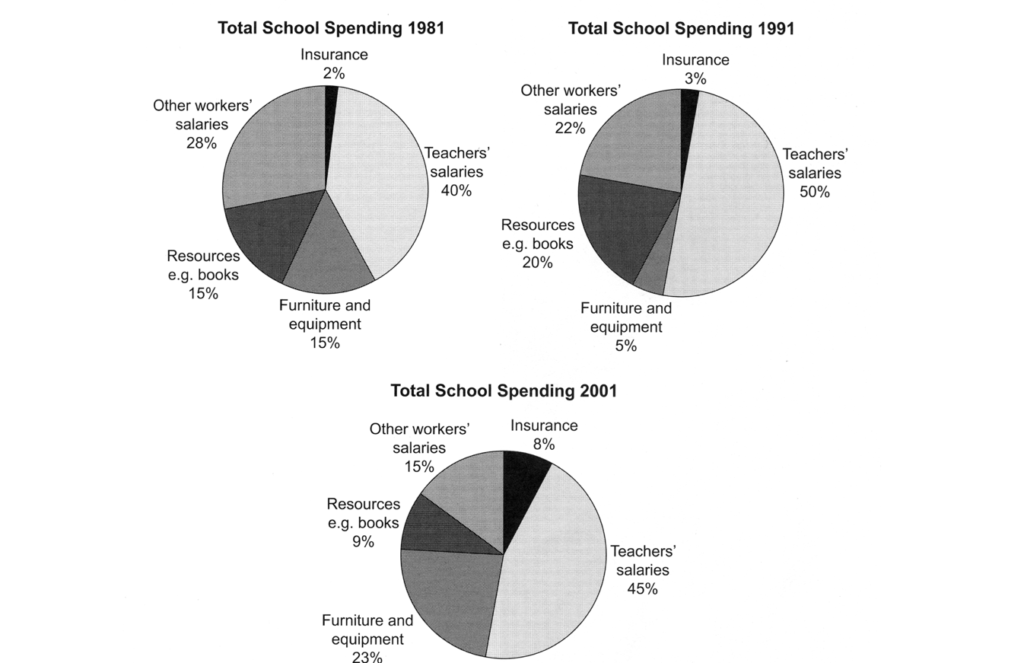
The three pie charts below show the changes in annual spending by a particular UK school in 1981, 1991 and 2001.
Summarise the information by selecting and reporting the main features, and make comparisons where relevant.
The graphs compare the changes in total school spending in the UK in 1981, 1991 and 2001.
Overall, it is noticeable that the largest amount of money was spent on staff’s salaries in all the aforementioned years. In particular, although there was a 5% decline in teachers’ salaries in 2001 in comparison with 1991, there was a significant difference in the percentage of the amount spent in this category compared with other ones.
Turning to the details, other employees’ salaries were the second larger expense in 1981 and 1991, representing approximately a quarter of total spending, whereas, in 2001, there was a marked drop to less than a fifth. Furthermore, 15% of total spending in 1981 was on materials, such as books, following a 5% increase in 1991 and a sudden decline to 9% in 2001 for this category.
In contrast, the cost of furniture and equipment followed the opposite trend. There was a decline and then, a steep increase in this expenditure, starting from 15% in 1981, fell to 5% in 1991 and rose to 23% respectively. Lastly, in all three years, there was a tiny fraction for insurance of 2%, 3% and 8% in 1981,1991 and 2001 accordingly.